AWA’s Progeny Test Program – Insights from COHORTS 1-4
The Harris family of Sunland Cattle Co, have been dedicated supporters of the AWA Progeny Test Program since its inception in 2021. Each year, Sunland have generously donated up to 400 fullblood cows to the program which are artificially inseminated with semen from sires that are nominated by members all over the world. The have dedicated their time and effort into collecting data that feeds back into BREEDPLAN and the Progeny Test Program to help measure and benchmark genetic performance across the registered wagyu herd.
As well as being a contributor herd, Paul and Jennifer have also nominated two sires in Cohort 2 (2022).
One of the benefits of participating in the PTP as a contributor herd owner is the improvement in genetic merit estimations for the females in your herd, along with increases in the accuracy of their EBVs as the cows and calves are measured for various traits throughout the program. In particular, gestation length, birth weight, milk and mature cow weight are being influenced by the data collected on the cow and calf and this will assist the herd owner for future breeding generations through producing more accurate breeding outcomes in their own herd.
Figure 1 illustrates the current accuracy changes for the two sires submitted by Sunland into the Progeny Test Program. SUNFH2241 has four carcase progeny submitted (outside of the PTP), which is reflected in the carcase trait accuracies. SUNFR0035 has not yet had any progeny carcase data submitted to BREEDPLAN; however, significant accuracy changes are evident for gestation length, birth weight, and 200-day weights.
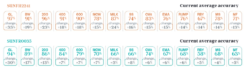
Figure 1: Current EBV accuracy for two Sunland Sires from Cohort 2 of the PTP, with the change in accuracy since entering the program. Data is from Wagyu BREEDPLAN December Run 1.
Cohort 1
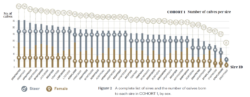
Cohort 1 consists of 1,010 Fullblood and Purebred calves, with an average of 26 calves per sire. However, the number of calves per sire varies, influenced by factors such as reproductive performance, semen quality, and contributor herd conception rates. A complete list of sires and the number of calves born to each in Cohort 1 is presented in Figure 2.
Recently, animals from Cohort 1 born in our contributor herds, Longford and Sunland, have been slaughtered – 45 from Longford and 80 from Sunland. Both steer contemporary groups were fed at Kerwee feedlot (Stockyard) for approximately 400 days before being processed at John Dee Warwick. All animals in these cohorts underwent AUS-MEAT carcase grading, with additional objective data collected using the MIJ camera, and samples were taken for Fatty Acid testing.
A breakdown of the carcase performance for these two groups will be presented at the 2025 Wagyu Edge conference in Perth.
Cohort 2
Cohort 2 has recently had all calf registrations finalised where 950 Fullblood and Purebred calves have been registered.
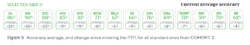
For the standard sires in Cohort 2, there have been significant increases in accuracy (Figure 3, particularly in gestation length, birth weight, and 200-day weight. This improvement is attributed to the substantial number of records submitted to BREEDPLAN. As these calves reach 400 days and their weights are recorded, we anticipate further significant increases in accuracy across all other traits.
Cohort 3
Cohort 3 calves are expected to finish calving in March 2025, with 158 calves registered so far. Samples from Sunland’s cohort 3 calves have recently been sent to Neogen for DNA testing, as part of the Progeny Test Program all calves born are 100K Genotyped to aid in the expansion of the wagyu reference population. In the coming months cohort 3 sires owners should expect to significant increases in accuracies for gestation length and birth weight.
Cohort 4
Over 1330 cows were joined in 2024 with the remaining cows to be joined in Autumn 2025. Where calving will begin in June 2025.
This year we have had two new contributor herds join the progeny test program, Bective Station Wagyu and Australian Country Choice.
Bective Station Wagyu is located just outside Tamworth NSW and is a subsidiary of the AAM Investment group. AAM Investment group is a wholly Australian owned company specializing in strategic investment, asset management, and operational services within Australia’s agricultural sector. Bective Station serves as the base for AAM’s seedstock Wagyu program, supporting the genetic improvement and expansion of high-quality Wagyu cattle. Its strategic location and extensive resources make it a key site for AAM’s long-term commitment to premium beef production and supply chain sustainability.
Australian Country Choice (ACC) is a vertically integrated company with properties and feedlots across Queensland. Their operations span the entire supply chain, including seed stock production, cattle breeding, backgrounding, farming, lot feeding, processing, retail packing, and distribution. While ACC has primarily specialized in short-fed, grain-finished cattle, they have also expanded into long-fed programs, including Wagyu and Black Angus.
This year, approximately 470 high-content registered females were joined in November 2024, creating an opportunity for large contemporary groups, where the progeny will flow through the ACC supply chain from birth to processing.
The AWA is grateful to have both Bective and ACC on board as a contributor herds and looks forward to collaborating with them throughout the progeny test program.
How are animals compared in contemporary groups? – Raw Data Vs Normalised data
Contemporary groups are a critical component of genetic evaluation, as they help separate an animal’s true genetic potential from environmental influences. However, several factors must be carefully considered when analysing contemporary groups, including age, environment, sex, and management practices, as these can significantly impact performance data. In the Wagyu Quarterly Update, Volume 89 Spring 2024, page 18 we highlighted how to get the most out of your performance data by optimising contemporary groups.
One key consideration in collecting, submitting, and analysing data is that not all traits are recorded at the exact same age. For example, within a contemporary group there can be up to 60 days between the first calf born and the last calf, in a practical sense for a 200-day weight to be recorded the calves are weighed on a specific day based on their “average age” meaning some calves can be up to 60 days difference in age. In this instance the lightest calf in the group may not necessarily be the calf which is genetically the lowest growth animal it may just be that it is the younger and therefore has had less time to grow. This variation in age presents challenges when comparing raw weight data.
BREEDPLAN generates a normalised trait value to address this issue in the analysis. This article aims to provide insight into how normalised trait values are used to compare animals despite age and management discrepancies.
Normalised trait values are produced by BREEDPLAN and are used to account for various factors such as age at measurement, sex and dam age . They allow for a fairer and more consistent comparison, where animals from different herds and generations can be compared on a like- for like basis. A prime example of using normalised trait values can be seen through the Progeny Test Program where multiple herds are collecting and submitting data to BREEDPLAN from around the country, each herd is responsible for their own data collection and management decisions and without normalising traits, it would be very hard to compare animals between herds.
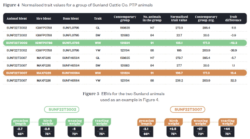
An example of how the normalised trait values are used in the analysis of a contemporary group can be seen in figure 4 which shows two PTP born animals in the Sunland herd that are in the same contemporary group. When comparing contemporary groups BREEDPLAN assigns the normalised trait submitted for each animal, an analysis group, a contemporary group average and a trait difference (Figure 4).
The first animal SUNF22T3002 has a normalised Weaning Weight (WW) of 135.1kg, and the average contemporary group WW is 177.3kg when this animal is compared to the average of the group is it is 42.2 kg lighter than the average. The second animal SUNF22T3007 has a normalised WW of 196.7kg’s which is 19.4 kg heavier than the average. This comparison allows the BREEDPLAN analysis to rank SUNF22T3007 as being heavier at weaning then SUNF22T3002, which in comparison to their respective EBV these results are expected (Figure 5). Birth weight, gestation length and yearling weight are also displayed in the table (Figure 5) as the same principles apply.
Another example of using normalised trait values is the comparison of two herds from the Progeny Test Program.
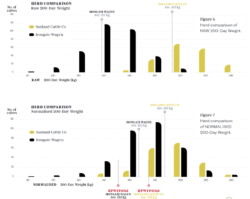
- Sunland, located in Central Queensland, weighed their Cohort 1 calves at an average age of 217 days, with an average raw weight of 197 kg. When normalised, the 200-day weight is 183 kg.
- Irongate, situated in Southern Western Australia, weighed their Cohort 1 calves at an average age of 157 days, with an average raw weight of 137 kg. When normalised, the 200-day weight is 163 kg.
This results in nearly a 60-day difference in the age of weight collection between the two herds and an average weight difference of 60 kg between the groups. As shown in Figure 6, the older Sunland calves appear heavier than the younger Irongate calves, introducing bias that makes it challenging to accurately assess genetic performance.
Figure 7 uses BREEDPLAN 200-day normalised weights to illustrate that, despite data being collected at different ages and under varying environmental conditions, normalisation allows for a fair comparison of phenotypic difference between the two herds. Once the data is normalised, the genetic differences within each herd can be determined.
Common sires used over multiple herds also aid in enabling comparison between herds, through identifying relative rankings of sire progeny compared to others within contemporary groups and between contemporary groups that may have had differeing management and environmental effects. An example can be seen in figure 7 where the averge calf normalised 200-day weight for the sire HPWFP0518 is 150Kg’s within the Irongate herd and 178Kg’s through the sunland herd. The sires used in both the Irongate and Sunland herds were largely consistent between both herds. Because of this, even though there is an observable average weight difference between the herds, the relative ranking of HPWFP0518 progeny to the herd average is roughly equivalent in both herds.
It is important to note that normalised weight traits are been adjusted only for age and do not account for other management or environmental factors like differences in pasture availability or creep feeding between herds.